How do I use the Respondents tab in Tree Testing results to manage respondents?
Table of contents
This section covers how to use the Respondents tab to:
Use the respondent list
View details about individual respondents
Filter respondents
Apply mass actions to selected respondents
Use the respondent list
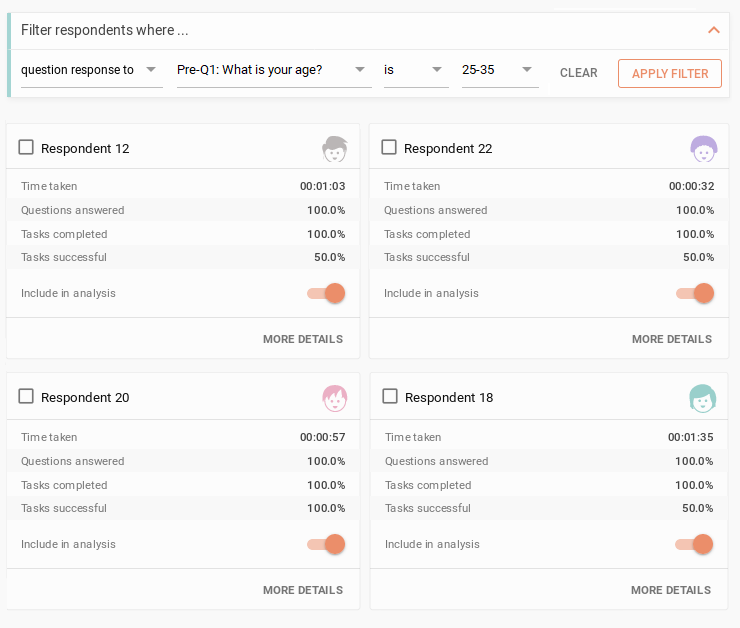
The list of respondents is the main feature of the Respondents tab. These are all the people who participated in your study. Each respondent’s entry contains:
The respondent’s number and icon. The icons are randomly generated and serve only for easier identification of respondents.
Respondent selection via a checkbox. Selected respondents are highlighted and can have several operations done on top of them.
Time taken – how long it took the respondent to complete the whole study.
Questions answered – the number of questions expressed by a percentage.
Tasks completed/skipped/successful – the number of tasks expressed by a percentage.
Include in analysis – determines whether the respondent should be counted in the calculations found under the Analysis tab. Respondents who abandon the study are excluded by default.
After you’ve adjusted which respondents should be included in the analysis, click Recalculate analysis above the list of respondents to apply the changes to the analysis (everything under the Analysis tab).
By default, the respondents are ordered by the time when they participated in the study. You can change this order by selecting a different sorting metric in the Sort by dropdown list above the respondent list. Click the arrow buttons to change between ascending (arrow up) and descending (arrow down) order.
View details about individual respondents
To view more information about the respondent, click More details beneath the respondent’s entry. There are four tabs in the detailed respondent modal view with the following contents:
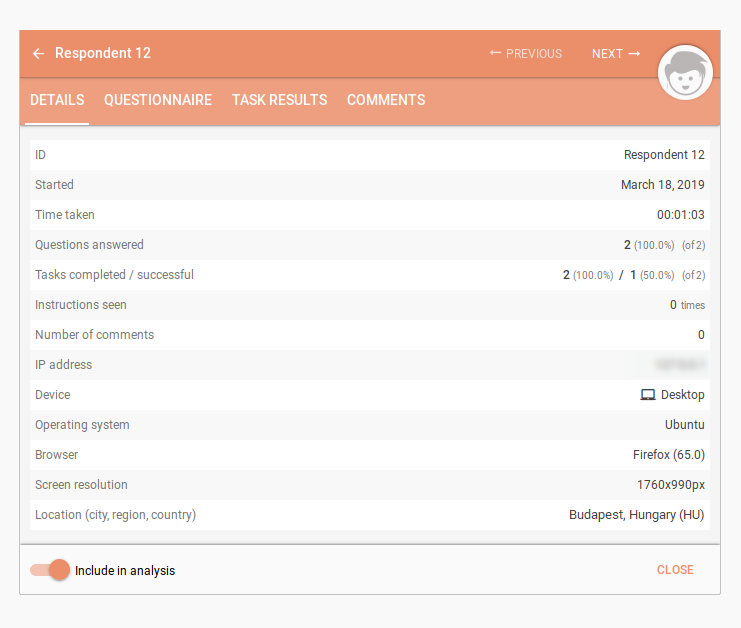
Respondent’s Details
ID – the number of the respondent
Started – when the respondent opened the study
Time taken
Questions answered
Tasks completed / skipped / successful
Instructions seen – count of how many times the respondent re-opened the study instructions after seeing them initially (seeing instructions for the first time doesn’t count)
Number of comments – how many comments the respondent left behind
IP address
Device
Operating system
Browser
Screen resolution
Location (city, region, country)
Respondent’s Questionnaire
Select the questionnaire you want to see answers for:
Screening question
Pre-study questions
Post-study questions
Questions after tasks
After selecting Questions after task, select the task the questionnaire you’re interested in is related to. Either use the task selection dropdown list or use the arrow buttons on the right and left sides of the task selection dropdown list to move between tasks one at a time.
The question results show the respondent’s answers for each question, as well as the question text and the list of available options (in case of multiple-option questions). If you include Skip Logic in your questionnaire, it is important to differentiate between:
Question skipped – the participant didn’t see this question because of the Skip Logic rules
Question seen, did not answer – the participant saw this question and decided to skip it
Respondent’s Task Results
This tab shows the respondents’ data for each task.
The result – Direct success / Indirect success / Direct failure / Indirect failure / Direct skip / Indirect skip.
Task text.
Time taken – The time from when the respondent sees the task until they submit their answer. If you selected Prompt respondents to start each task with a button, this time is calculated from the press of the button.
The answer – Where in the tree the respondent marks their answer.
Correct answers – The correct answers to the task (to facilitate analysis).
Respondent’s Comments
The comments left by the respondents during the study. Each comment contains text and information about the step of the study during which it was submitted.
Filter respondents
Filter the respondents to display only the ones who meet certain criteria.
You can filter the respondents based on the time it took them to complete the study.
If your questionnaires contain multiple-option questions, you can also filter the respondents based on their answers.
Enter your filter and then press Apply filter to filter the respondents.
If any selected respondents become invisible due to a filter, they will also be de-selected.
Respondent list
The respondent list provides you with basic information about respondents. Decide whether you want to include a respondent or not using your own criteria.
Detailed respondent overview
This view shows all known information about the particular respondent. It can be used for detailed filtering or meticulous analysis of individual respondents.
Apply mass actions to selected respondents
You can either select respondents individually or in mass by using the Select all and Deselect all buttons.
Deselect respondents by a chosen criteria by using the filters.
Pick an action that you want to do with the selected respondents and click Go to execute it.
Mark as included/excluded marks all selected respondents as either included or excluded in the analysis.
Delete permanently deletes all of the respondent’s data related to the study.
Export as CSV exports details about the selected respondents (the same details as seen in the Respondent’s Details tab) as a CSV spreadsheet.
We need your consent to use cookies
on our website to provide you with the highest level of service.
You can change the settings by clicking the "Settings" button.
These cookies are necessary to ensure the operation and basic functions of the UXtweak website.
They store information about your UXtweak session and help protect your privacy.
Analytics cookies
These cookies are used to analyze traffic on our website, so that we can better understand our users
and improve the site's content, usability and functionality.