





Standardization grid
Get an overview of placements of cards in your standardized categories.
This section covers how to use the Standardization Grid in open and hybrid card sort analysis to:
The cell’s blue background portrays the percentage of respondents that the number inside represents. The darker the shade of blue, the higher the percentage.
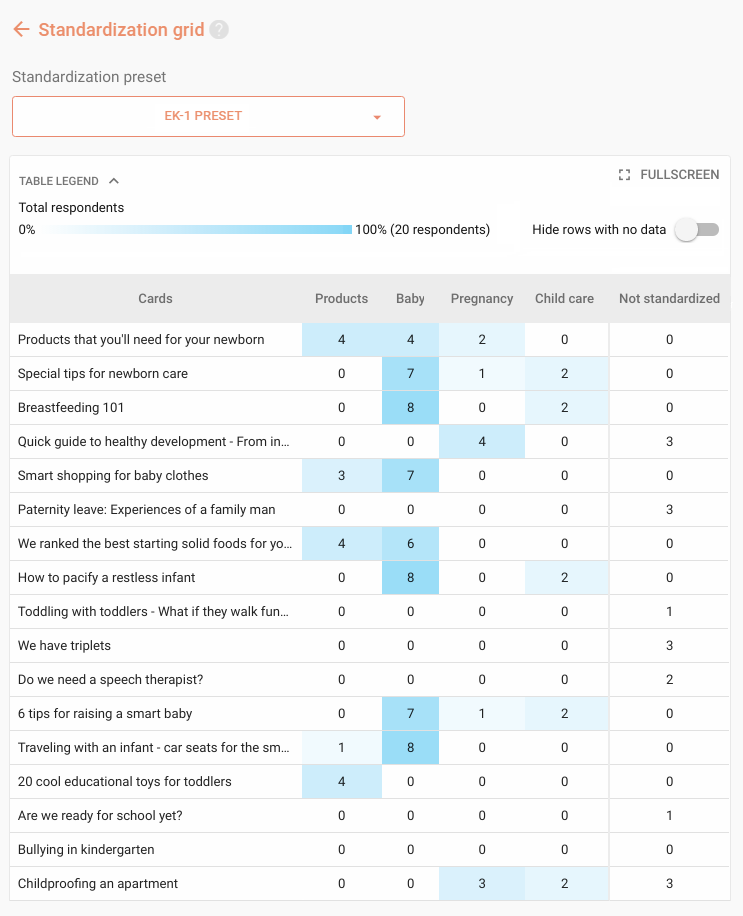
Get an overview of placements of cards in your standardized categories.
You can create a PDF report of all the information listed above, exactly like you can see in the web interface. To create an export, click PDF Export in the upper right corner of the tab contents.
If you wish to create a report using more than one section of your study’s results, go to the Export tab.