How do I interpret the Task Statistics in Preference Test?
Table of contents
In this help, we’ll discuss how to use the Task Statistics analysis to:
View Task Statistics per task
Understand statistical significance of results
View Task Statistics per task
This analysis displays Task Statistics one task at a time
Use the task selection dropdown list in the top section of the screen to switch to the task you want to analyze.
Alternatively, use the arrow buttons to the left and right of the dropdown list to move to the previous/next task.
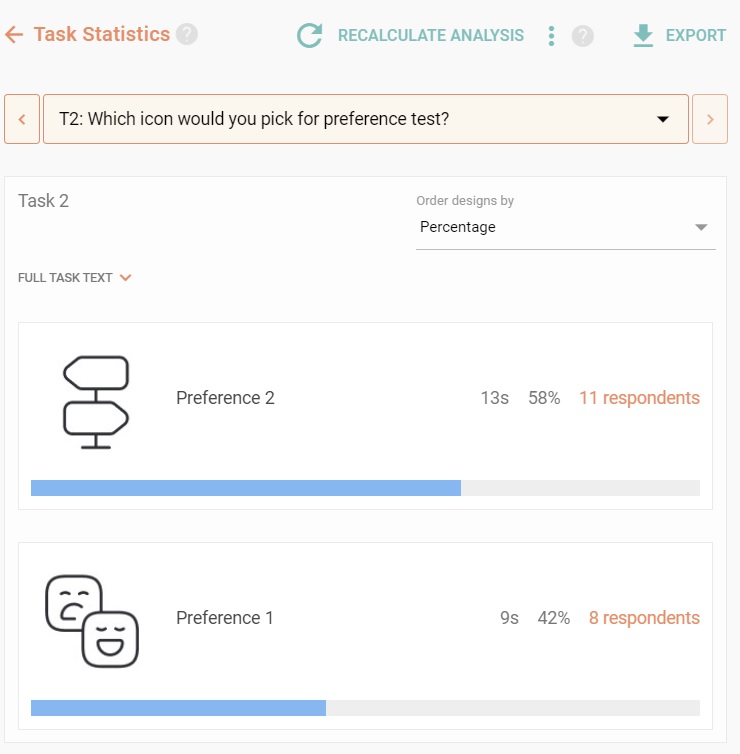
For each task, Task Statistics contain the task’s text and the list of designs included in the task. Each design includes the following data:
Design
Design label
Average completion time– How much time did this task take to complete to the respondents who picked this design
Percentage of respondents– What percentage of respondents picked this design
Number of respondents– How many respondents picked this design. Click to see a full list.
Understand statistical significance of tasks
Statistical significance in a Preference Test tells you how much you can rely that the given result is the effect of respondents truly preferring it over the others. If statistical significance is low, it means the result has likely placed in first place only by chance.
You need to collect the number of respondents that is at least5 times the number of tested designs in a taskin order to properly calculate statistical significance.
Statistical significance is expressed as a percentage ranging between 0% (no statistical significance) and 100% (statistical significance absolutely guaranteed)
99%-100%– The results are surely statistically significant
95%-98%– The results are probably statistically significant
90%-94%– The results tend towards statistical significance
51%-89%– The results probably aren’t statistically significant
0%-50%– The results aren’t statistically significant
Respondent list
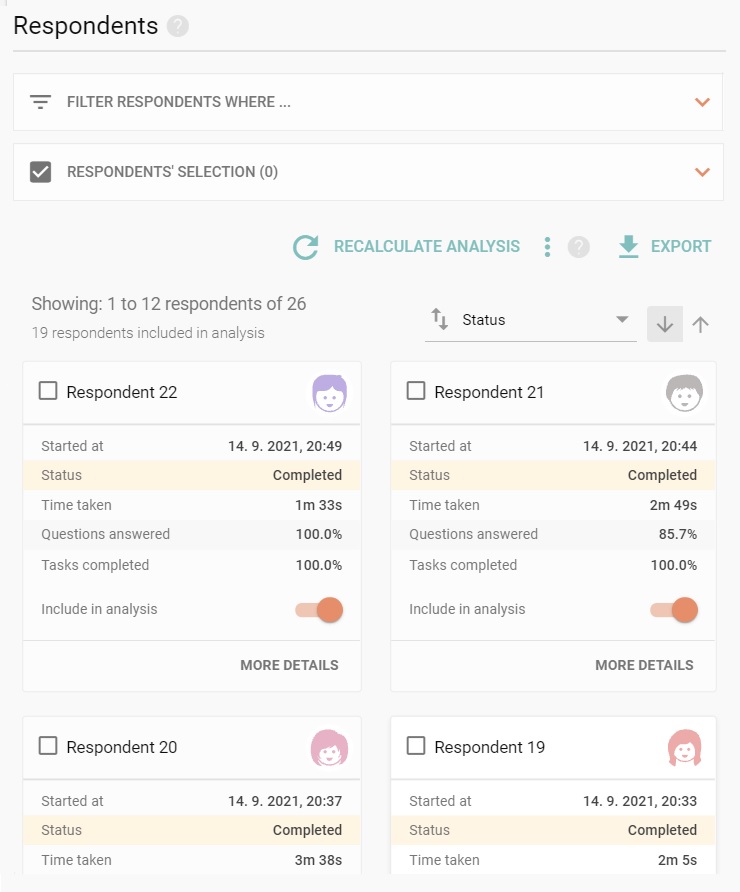
The respondent list provides you with basic information about respondents. Segment your respondents depending on your own custom criteria.
Task statistics
For each task (design comparison) the number of preferences, as well as the percentage and the average time of selection are provided for each design.
We need your consent to use cookies
on our website to provide you with the highest level of service.
You can change the settings by clicking the "Settings" button.
These cookies are necessary to ensure the operation and basic functions of the UXtweak website.
They store information about your UXtweak session and help protect your privacy.
Analytics cookies
These cookies are used to analyze traffic on our website, so that we can better understand our users
and improve the site's content, usability and functionality.