How do I use Heatmaps and funnels to learn more about my prototype?
Table of contents
In this help, we’ll discuss what can you learn from:
Task Summary
Design detail
Design heatmaps and clickmaps
Design statistics
Funnels
Task Summary
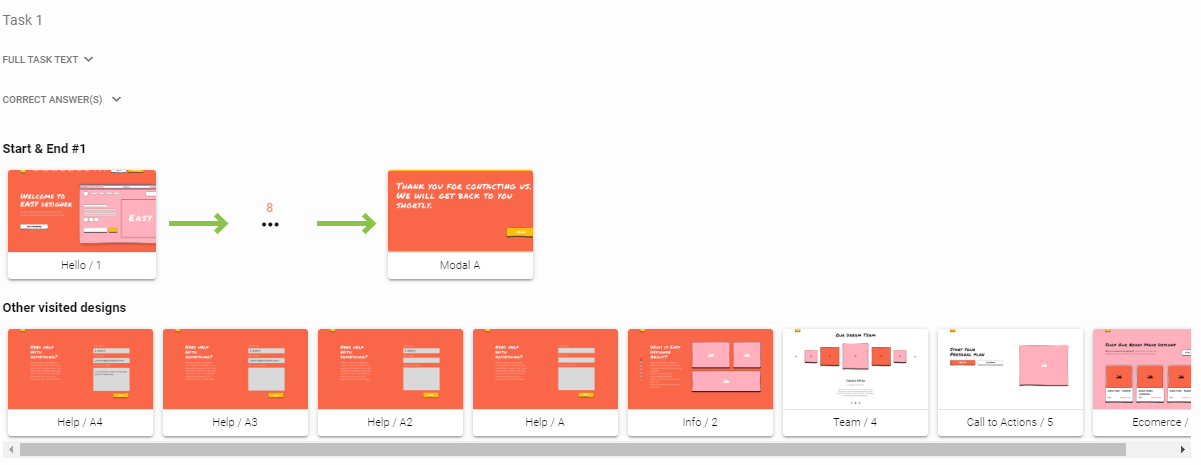
If you choose to view the summary of a specific task you will be provided with a high level overview which will tell you:
The full task text, which was shown to the participants.
What were the correct answers set up for this task (either the full paths or the ending designs).
How many participants succesfully completed the task. Participants are split by the used path or by the end design where they finished the task.
Which designs were visited during the task by at least one of the participants.
Task Summary
In this specific case we can see that the task had only one correct answer and 8 participants managed to successfully complete the task
Design detail
After selecting a specific design, you will see the detailed results for that design. These results include:
Design heatmaps and clickmaps
Design statistics
Funnels
Design detail
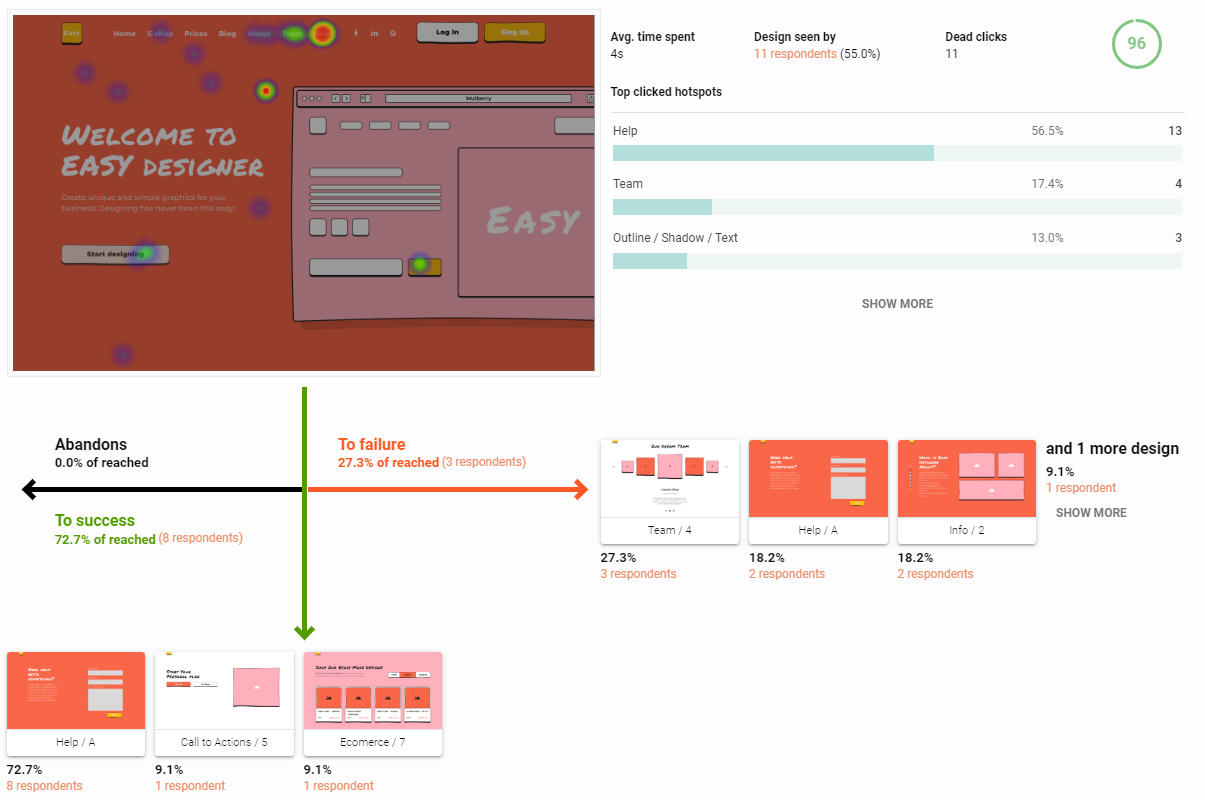
On this screen you can review design heatmap, clickmap, statistics and funnels
Design heatmaps and clickmaps
After clicking on the design in its detail view you can switch between heatmap and clickmap as well as reviewing them in a fullscreen size.
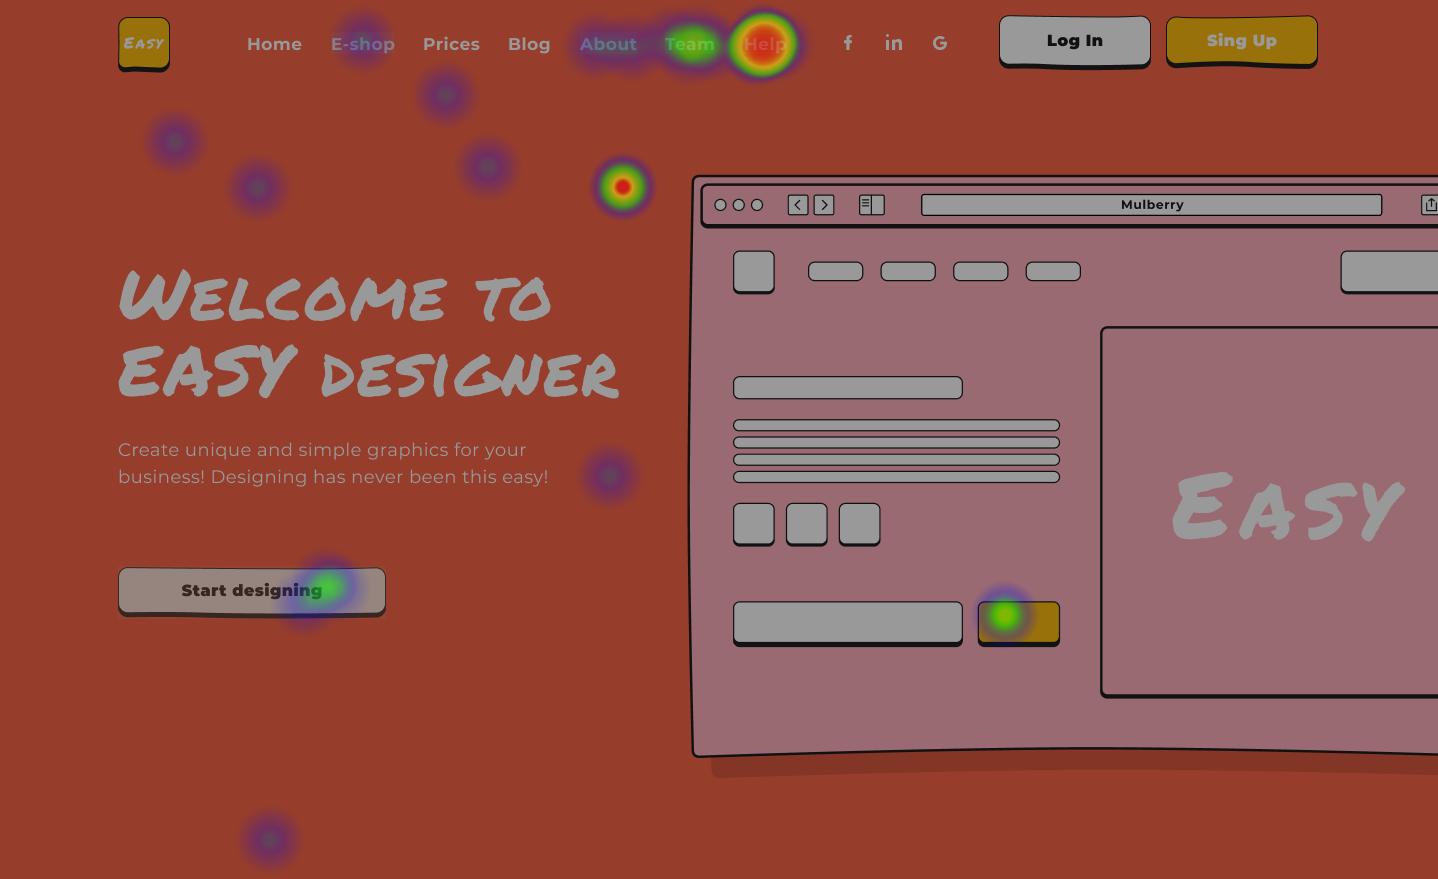
Heatmapis better suited to quickly learn in which sections of the design was the activity (clicks) of the participants focused. The most active sections will be marked as red, while the less active sections would be in blue.
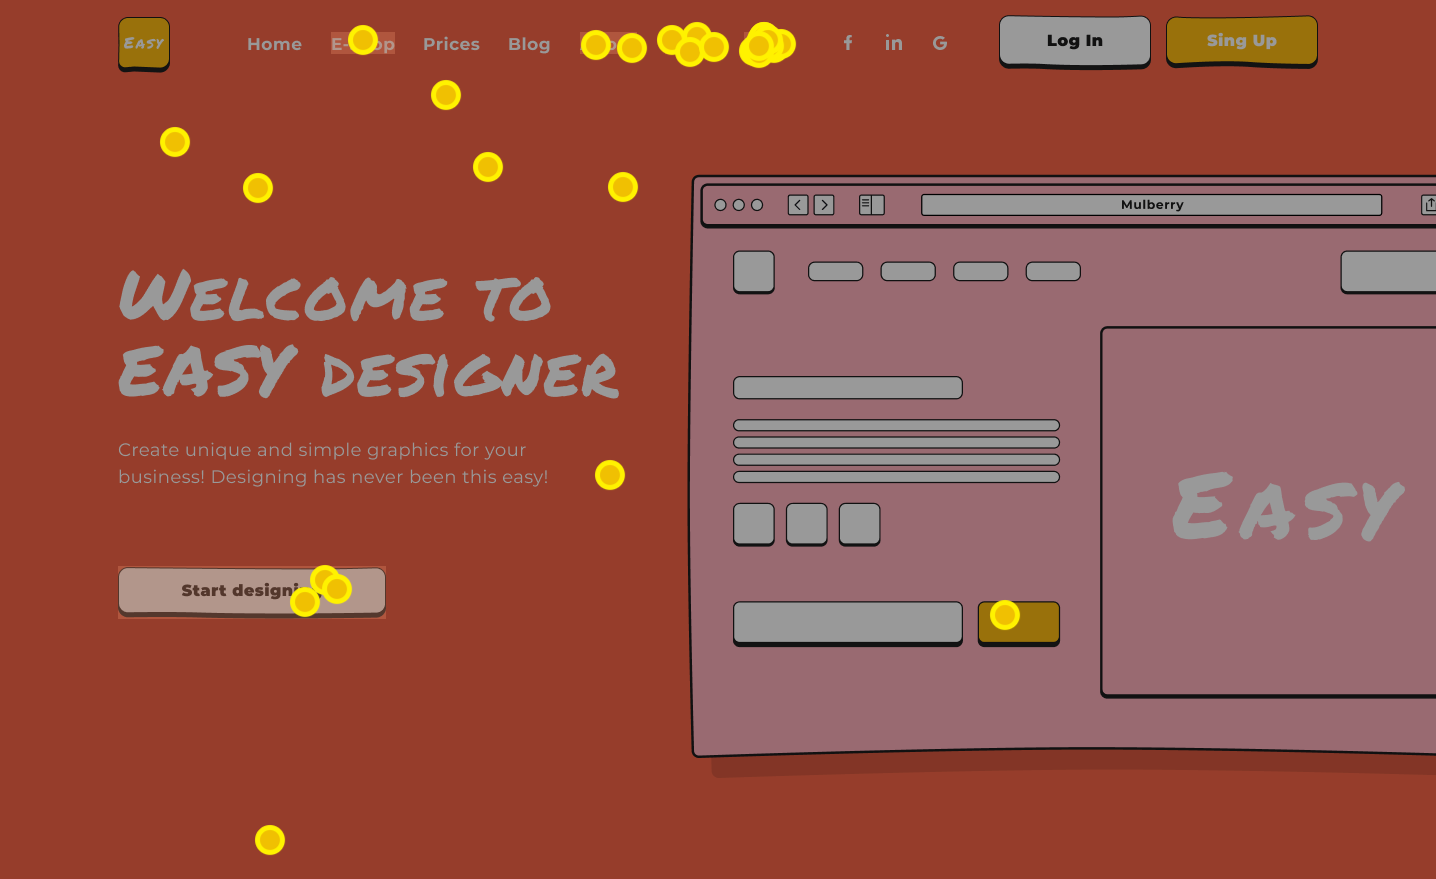
Clickmapprovides you with an alternative view where each and individual click is clearly distinguished, compared to heatmap where the clicks are merged into one blob. If there is an overlap of the clicks these sections will be marked by pulsing light.
Heatmap
Easily learn where the activity of the participants was focused
Clickmap
Review each click individually
Design statistics
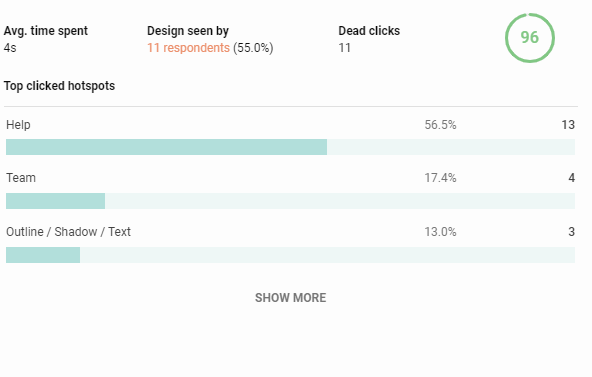
Use these results to learn more about your design in numbers:
Average time spend– learn how long the participants remained on your design
Design seen by– we count how many participants viewed each design, so you know if they were able to reach it or not
Dead clicks– all clicks outside the borders of defined hotspots are counted. This number is aggregated across all participants.
Top clicked hotspots– learn which hotspots were clicked on the most by your participants with both absolute number of clicks and the percentage
Design score– a single value from 0-100 which provides a quick evaluation and a single comparable point evaluating the usability of the specific design
Design detail
On this screen you can review design heatmap, clickmap, statistics and funnels
How does Design Score work?
First of all the design score doesn’t evaluate the looks of your design, only its usability. This score is meant to provide you with a single value, which can be used to compare designs with eachother. The score is calculated on the range of 0-100. Higher score means that a design is more intuitive and easy to use compared to a design with a lower score.
The following factors lower Design Score (DS) of your design:
Dead clicks (DC)– each click outside of the defined hotspots lowers the DS. This is caused by the fact that dead clicks are made by the participants usually in cases where a non-clickable element is designed in a way, which leads participants to believe that the element can be clicked. Every percent of a dead clicks, loses 0.5 points
Average time spent on the design (TS)– if a participant spends too much time on your design, it usually means that they are unsure what to do next. The penalisations are as follows:
0-5 seconds– no penalisations
5-25 seconds– 1 point deducted for every 2 seconds
25+ seconds– 10 points are deducted
Dropouts (DO)– if a participant prematurely ends the task while they are on this specific design, they are considered a dropout. For every percent of participants who drop out we deduct 1 point from the DS.
Veering of to a wrong path (WP)– these are participants, who click on a hotspot, which takes them of the defined “success paths” For every percent of participants who veer of the “success paths” we deduct 1 point from the DS.
The final formula used to calculate the Design Score (DS) is as follows:
The resulting score will fall into one of these 4 categories:
80-100– designs with very good usability
60-80– designs with passable usability
40-60– designs with lacking usability
0-40– designs with very bad usability
Funnels
With the funnels you can quickly analyze how the participants proceeded in solving the tasks after leaving this design.
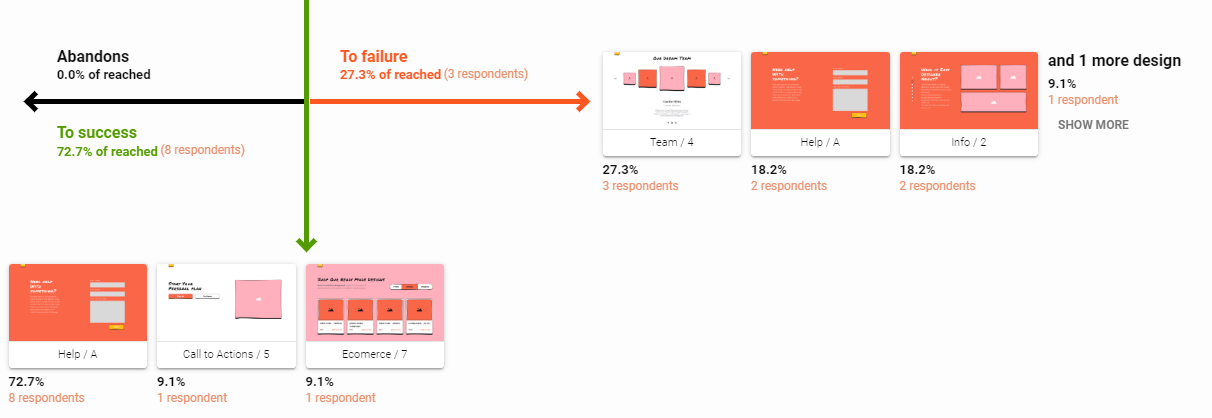
See the percentages of the participants, who went on to succeed in the task, fail the task or abandoned the task
Analyze which designs were the next stop for participants on each type of the path
In this specific case:
We can see that 8 participants, who visited this design suceeded in this task, which makes up 72.27% of the all participants, who visited this design.
Every successful participant visited the design “Help / A” after this design. This is denoted by the same number and percentage of the participants as the overall values for the success participants (8 and 72.27%)
We can also see that other designs were both visited by 1 participant (9.1%). This means thatsome of the participants visited a different design, backtracked to the current design and continued on the correct path afterwards.
Funnel overview
See the breakdown of how many participants succeeded, failed or abandoned the task after visiting this design.
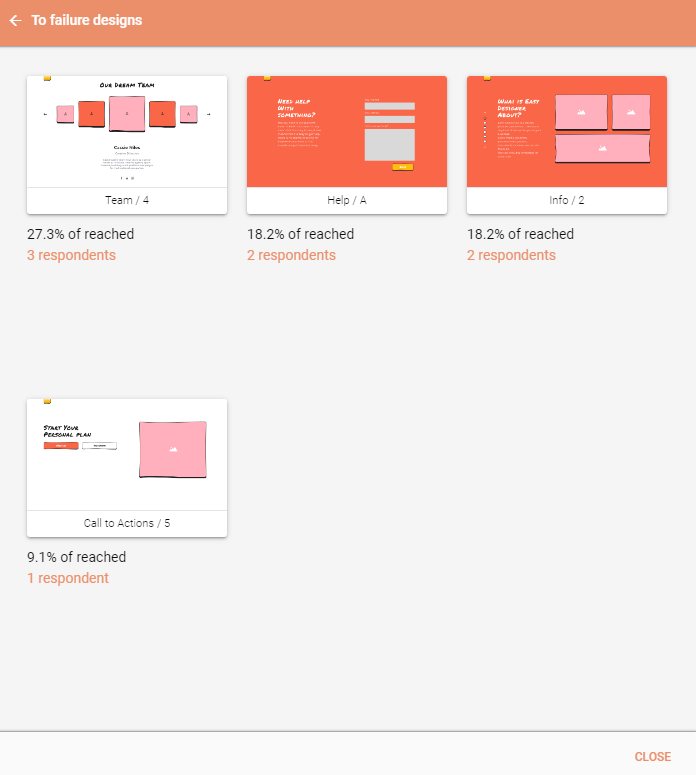
Funnel design details
Analyze the breakdown of all designs visited immidiately after this design for a specific task status.
We need your consent to use cookies
on our website to provide you with the highest level of service.
You can change the settings by clicking the "Settings" button.
These cookies are necessary to ensure the operation and basic functions of the UXtweak website.
They store information about your UXtweak session and help protect your privacy.
Analytics cookies
These cookies are used to analyze traffic on our website, so that we can better understand our users
and improve the site's content, usability and functionality.