How do I use the Overview tab in Session Recording results?
Table of contents
In this help, we’ll explain the information found in the Overview tab.
Sessions per Period
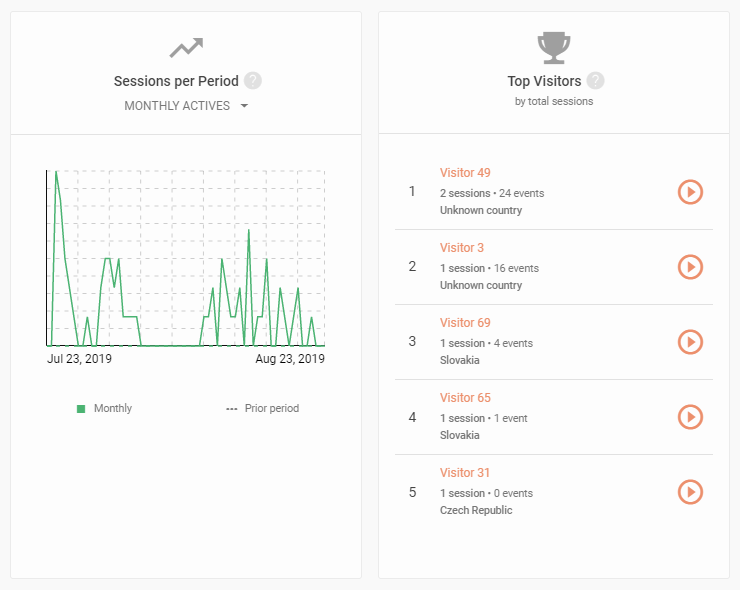
This diagram displays the development of the number of session over a chosen period of time
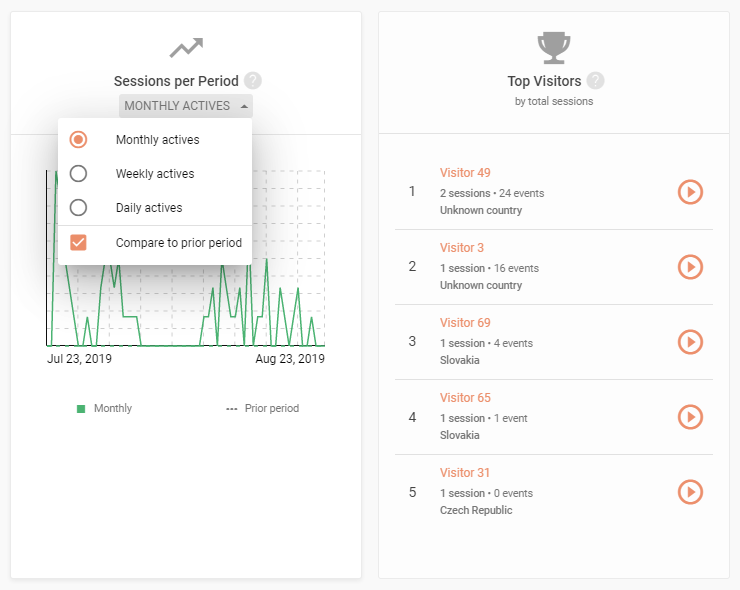
In the dropdown list above the diagram, select the time period – daily, weekly or monthly
Click a point in the diagram to see the number of sessions and the time it represents
In the dropdown list above the diagram, select Compare to prior period to also show the development of the number sessions over the previous day/week/month
Top Visitors
The top five users who showed the most activity on your website
The score to determine the top users is calculated as the (number of sessions) x (the number of events + 1). The +1 assures that users are ordered by their number of sessions if their number of events equals zero.
Monitor activity and find your most active users
Sessions per Period is a diagram of the number of sessions recorded on your website over a set period of time. In Top Visitors, you can take look at what the users who interacted with your site the most were doing. Click the replay button to watch their last session.
Adjust the monitoring period
By clicking the period dropdown, you can decide if you want to watch the development of the number of sessions over the last month, week or day. Check “Compare to prior period” to see how your visits compare to the previous month, week or day.
Sessions Health
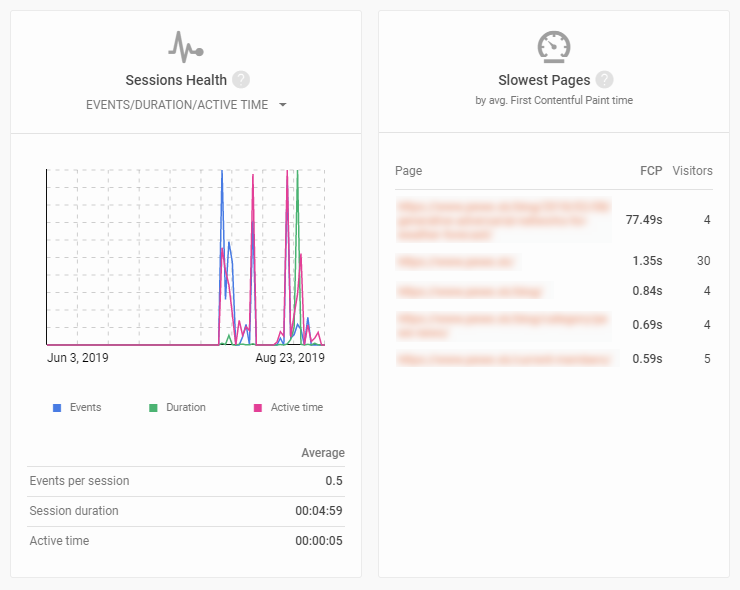
The Sessions Health diagram gives you a visual representation of three different metrics of the quality of sessions over the previous 81 days
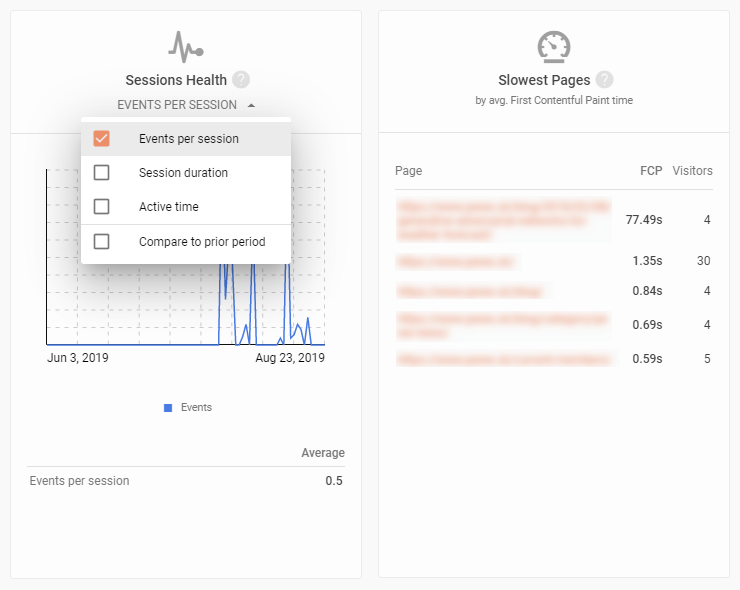
Click the dropdown above the diagram to select betweenEvents per session, Session durationandActive time
Events per sessionis the rate of the number of events (clicks, form changes) to the number of sessions
Session durationis the average length of a session (session automatically terminates after 30 minutes of inactivity)
Active timeis the average time spent on interacting with the website / web app (non-idle time)
Slowest Pages
The top five pages on your website that were the slowest to load
The metric used to measure the speed of loading isFirst Contentful Paint– the time until the browser renders the first piece of content (e.g. text or an image)
Monitor session health and discover slowest pages
Session health shows you the quality of recorded sessions as the distribution of three distinct metrics over the period of the last 81 days. Slowest pages show you which pages on your website took the longest to load.
Choose a session health metric
For easier reading of the session health diagram, you can hide the plotted lines of the individual metrics and only focus on one at a time. You can also compare session health with what it looked like during the previous 81 days.
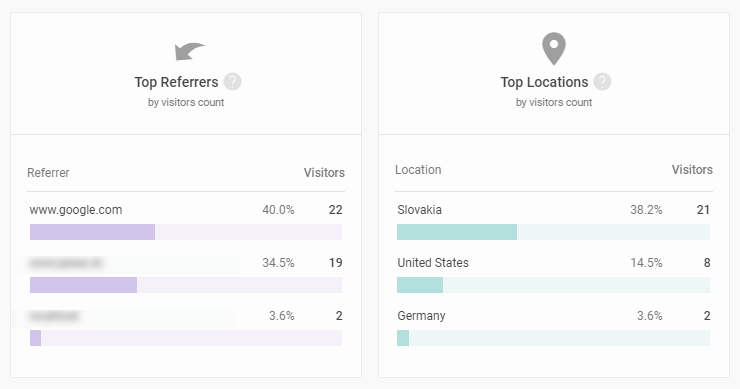
Top Referrers
The top three websites that linked (referred) visitors to your website / web app
Top Locations
The top three countries that your visitors accessed your website / web app from
Location is determined based on the respondent’s IP address and as such can be inaccurate (such as when the respondent is using and out-of-country VPN or other means to obfuscate their presence online)
Top referrers and locations
Top referrers are the sites that directed most users to your website. Top locations show countries that your users were coming from the most often.
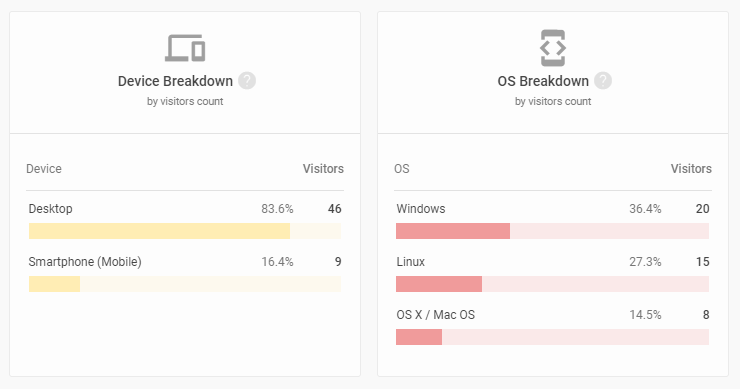
Device Breakdown
The top three types of devices that your visitors accessed your website / web app from
OS Breakdown
The top three operating systems that your visitors accessed your website / web app from
Device and OS breakdown
Find out what types of devices and operating systems were most popularly used by your visitors.
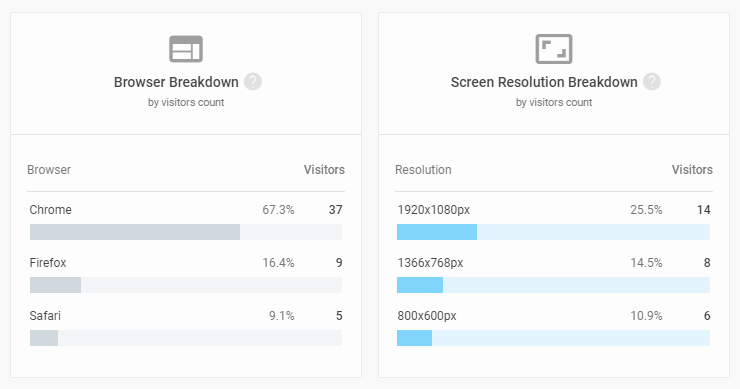
Browser Breakdown
The top three browsers that your visitors accessed your website / web app from
Screen Resolution Breakdown
The top three countries that your visitors viewed your website / web app in
Browser and resolution breakdown
Find out what browsers and what screen resolutions have your visitors viewed your website from the most.
We need your consent to use cookies
on our website to provide you with the highest level of service.
You can change the settings by clicking the "Settings" button.
These cookies are necessary to ensure the operation and basic functions of the UXtweak website.
They store information about your UXtweak session and help protect your privacy.
Analytics cookies
These cookies are used to analyze traffic on our website, so that we can better understand our users
and improve the site's content, usability and functionality.