Respondent sees this
This is what a statistical significance looks like in UXtweak.
Learn how to set up and use UXtweak
Explore possibilities with demo studies and results

Export and analyze insights faster. Sync your favorite tools with UXtweak
Resources for mastering research, design and product
Definitions of UX terms and phrases
UX insights and tips to sharpen your skills

Studies published in peer‑reviewed journals and industry publications.
Watch our quick, educational UX videos
Listen to top researchers share their stories, wins, lessons
Apart from analyzing how many respondents prefer which of your design variants in total and as a percentage, Preference Test also provides you with information about statistical significance of the task results. How big is the chance that the given result is the effect of respondents truly preferring one design to the others?
If you’re unfamiliar with how Preference Test calculates statistical significance, you can read more about it in our Preference Test Task Statistics article. If you’re already familiar with the concept, continue reading to learn how to set the target number of respondents to recruit in your study to achieve results of satisfying statistical significance.
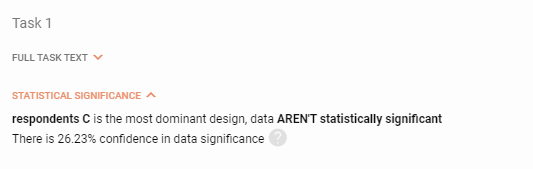
This is what a statistical significance looks like in UXtweak.
To provide enough power to the Chi-Square Test which forms the backbone of statistical significance calculation, you’ll need to collect a respondent sample of sufficient size. This size varies depending on the number of visual/audio/video designs which you’re aiming to compare. Naturally, with more designs to choose from, you also need more participants if you want the test to have the same degree of reliability.
Here are our recommendations for how many people to recruit to achieve the best informative results. Let’s assume that we require a confidence level of at least 90% and medium effect size (meaning there will be medium differences between user preferences for individual designs – larger differences require a smaller sample size, smaller differences require a larger sample size to achieve the same confidence):
| Number of designs to compare in a single task | Recommended number of respondents for the task |
|---|---|
| 2 | 69 |
| 3 | 86 |
| 4 | 98 |
| 5 | 108 |
| 6 | 116 |
We calculated these results with the help of this online sample size calculator. You can adjust the entry parameters to calculate your own sample size in a similar manner.