After a card sorting study, you’ll be left with a lot of data. However, until it’s all analyzed and synthesized it doesn’t really deliver many insights into how users perceive your content. It’s time to go over the results and make sense of all the data.
But how to do so? Well, you can either go about it manually or, in case you’re using an online card sorting tool, most of the analysis will be done for you automatically. Further in this article, we’ll focus on explaining how you can analyze the results of your card sort with the help of an online tool such as UXtweak.
However, first, let’s take a look at how you can analyze the results manually.
How to analyze card sorting results manually?
Okay, let’s say you have all the data, now what?
If you were conducting a closed card sorting study, your task now is to see how well the proposed groups matched people’s expectations. Were all cards sorted out? Or did users hesitate when sorting some of them? Answering these questions will help to decide if the proposed structure works or if you need to make changes by adding other groups or eliminating useless ones.
In the case of open or hybrid card sorting the analysis process is a bit more complicated.
Oriol Banus in his Card Sorting Guide on Medium suggests an excellent methodology for manual analysis of card sorting results:
1. Look for common categories
First things first, try to identify patterns in the category names that users proposed. Most of the time it’s quite easy to spot a couple of common categories that repeat themselves from tester to tester. If many people decided to create such a category it’s definitely a sign that you need it in your structure.
Don’t pick categories that were only created by one user. Instead, look for common patterns and similarities.
2. Organize the data
The simplest way to do it is to create a spreadsheet. The rows can be your cards, while in columns you put common categories you identified in the previous step. Then, write how many times each card was put into the category, either in numbers or percentages.
Percentages will make the following steps easier so we recommend using them. Use color coding to make it more readable and easy to analyze.
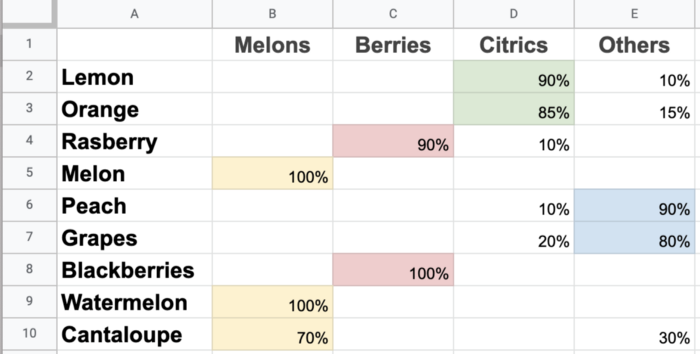
Source: UX Planet
3. Finalize the sort
All you have to do now is delete all the numbers that show less than a 50% match. Resort the cards again to see what groups they belong to.
How to analyze card sorting results with a card sorting tool
Now let’s take a look at how you can analyze the results of a card sorting study inside an online card sorting tool. Spoiler: it’s much easier and faster.
UXtweak analyzes the results of your card sorting study by calculating metrics and aggregations that make the outcome of your study easier to interpret than if you were looking at responses one by one.
This allows you to look at the data from various perspectives. The analytics include a number of grids and diagrams that reflect the connection of cards to each other as well as to categories.
While some analytics are exactly the same in every Card Sorting, others differ depending on whether your Card Sorting is open, closed or hybrid.
Open and hybrid studies are oriented toward the exploration of card relations and the meaning of categories. Closed card sorting results focus more on the evaluation of the pre-defined category model. Let’s take a look at Card Sorting results and what you can do with them.

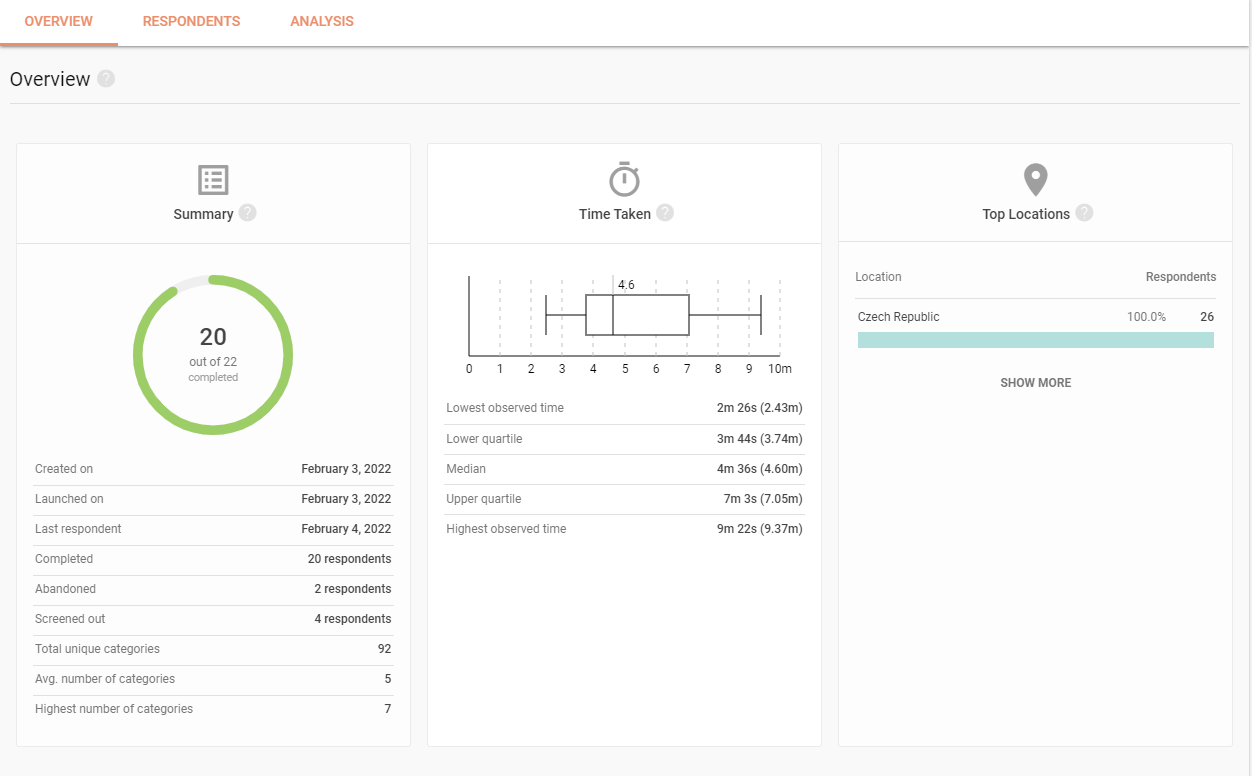
Overview
The Overview section is the mainstay of every UXtweak study results. It shows you a quick summary of how your study is going. Here you can find the median time taken to complete your card sorting, which tells you if your study has an appropriate length. In the top locations, you can keep track of the countries that your respondents come from.
Handy donut charts give you information on how many respondents have participated in the study and how many of them managed to actually complete it.
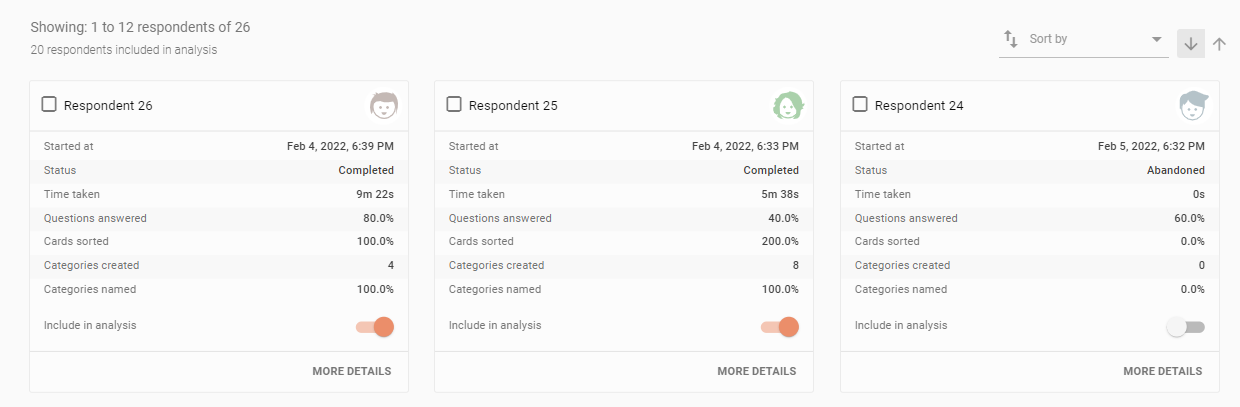
Respondents
The Respondents section provides you with detailed profiles of your respondents. Here you can see when they started the study, how long it took them, what device they used, their location, and browser information. The respondent details will also show you how the respondent answered the questions and how they sorted cards into categories.
With each respondent, you can choose if you want to include them in the analysis or not, to analyze them in segments, or to filter out the ones that you think are irrelevant. With filters, you choose to only display the ones who meet certain criteria (age, time it took them to complete the study, etc.)
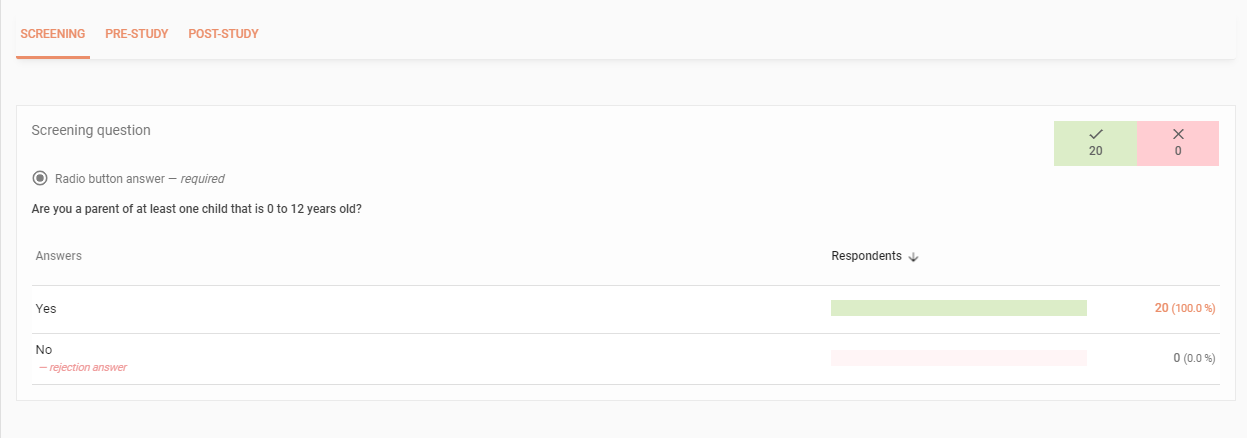
Questionnaire
The answer to the Screening question, as well as the results of the Pre-Study and Post-Study questionnaires are all found in the Questionnaire Analysis. Beneath the question’s text, you can find all the answers along with the number of users who submitted them.
Cards and Categories
Simply put, the Cards analysis and the Categories analysis are two sides of the same coin. For every card, the Cards analysis sums up which categories it was placed into. Meanwhile, the Categories analysis shows you all the categories (predefined or respondent-defined) and it tells you which cards are in it. In open and hybrid Card Sorting, here you can also standardize your categories. Standardization is when you decide that two or more categories created by different respondents are actually the same category.
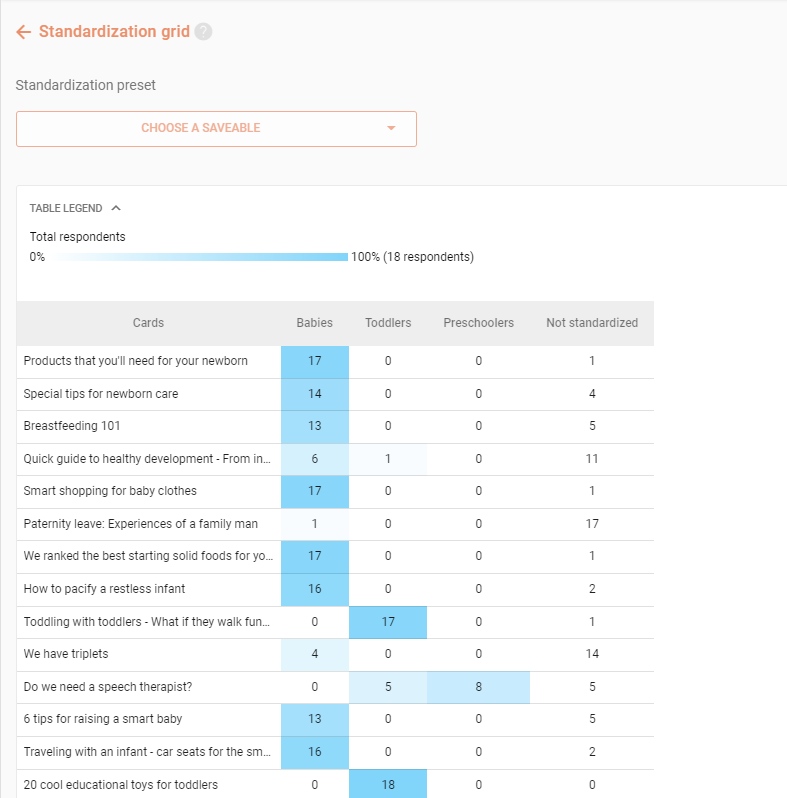
Standardization Grid and Results Matrix
Standardization Grid shows you the distributions of cards between standardized categories. It is generated from the results of an open and hybrid Card Sorting. The blue color of the cells visually represents the percentage of users who sorted that card into the original categories that the standardized category was made from. The darker the shade, the higher the number. It’s an easy way to get an overview of how the cards were placed.
The Results Matrix is a very similar analysis specific to closed Card Sorting. Since there’s no need for standardization, here it shows you how many times each card was sorted into any of the predefined categories.
Popular Placements Matrix
This analysis can give you quick answers when you’re conducting a closed Card Sorting study. Particularly if your question is: “Where would the majority of people place each of these cards?”. With a dark hue, it shows you the popular placements – the most popular category for each individual card.
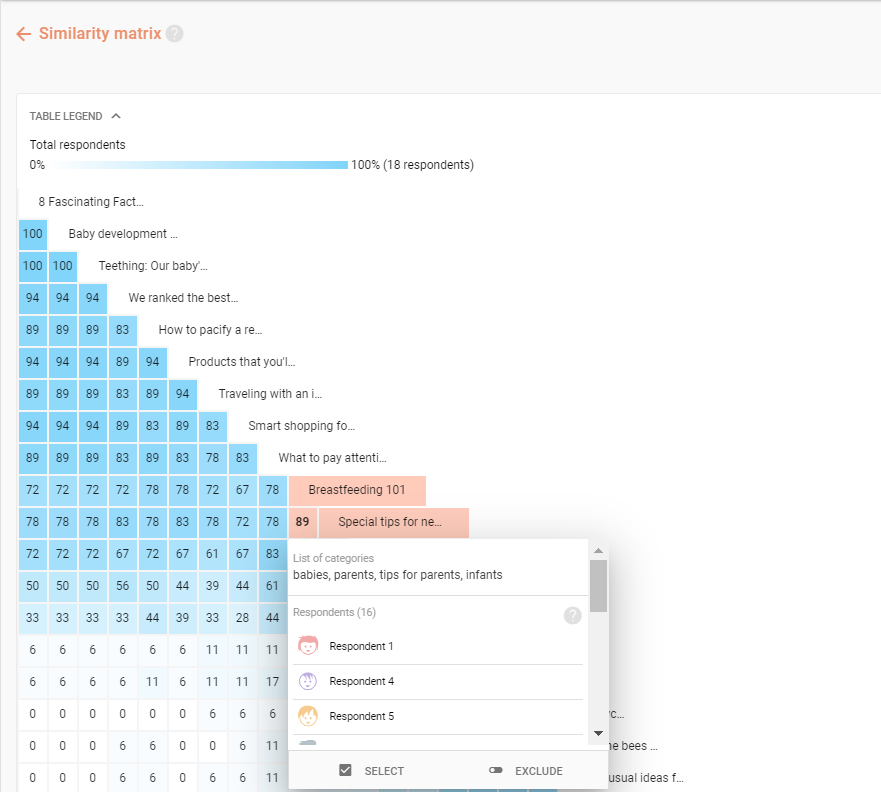
Similarity Matrix
The Similarity Matrix puts all the cards in a grid that shows how often each individual pair of cards was placed into the same category. This is ideal for finding clusters of cards that belong with each other, regardless of what exact categories they were sorted in. The percentage of each grouping is also visually represented by different shades of blue color. The darker the shade, the more the percentage. By clicking the numbers you can see the names of categories in which the respondents commonly group these cards.
Dendrogram
Dendrograms are related to the Similarity Matrix in that they show relationships between cards but in a different manner. Instead of a grid, you get a tree-like diagram, where the branches represent cards that were grouped together by a certain number of respondents. The higher the branches, the higher the percentage of people who agree that these cards belong together.
Respondent-Centric Analysis
The Respondent-Centric Analysis (RCA) takes a different view at card sorting results. It automatically finds respondents who are the best representatives of popular sorting strategies that were utilized by your respondents. If there are segments of your audience characterized by different ways of thinking, the RCA will find them and show you what their approaches are.
Wrapping up
Now you’re all set for your next card sorting results analysis! Remember, that no matter how much data you gather, when approaching the analysis process systematically, there should not be a problem to come to valuable conclusions.
Use this guide as your roadmap to card sorting results analysis and good luck with your research! And don’t forget that with UXtweak you can conduct card sorting for free. Just create an account and start testing today!