Usability testing metrics are essentially used to quantify the usability of your product, evaluate it based on different criteria and use this data to inform further design iterations as well as compare results and track success.
They help to make sense of the data obtained in usability studies and give a clear picture of what you need to work on in order to improve.
Let’s dive into all the different types of usability testing metrics and learn how you can use them to evaluate and improve your digital product’s usability!
Key takeaways:
➡️ Usability testing metrics help to quantify usability
❗ They are useful for spotting usability issues, tracking progress, benchmarking and justifying investments
✅ There are 3 main types of usability testing metrics – evaluating Effectiveness, Efficiency and Satisfaction
🧠 You can use those metrics to effectively compare two designs between each other and evaluate their usability
💡 Measuring usability is essential to keep track of your product’s performance and spot issues early on
Quick article summary ⬇️
Why do you need to measure usability?

Measuring the usability of your digital product is crucial for several reasons:
- Spotting usability issues: by keeping track of the usability testing metrics for your product you’re able to quickly spot areas that need improvement and fine-tune them for better user experience.
- Tracking progress: measuring metrics over time or after making a certain improvement can help to evaluate their effectiveness and see how well you’ve solved the issue.
- Benchmarking: by comparing your product’s usability metrics to some of the industry standards or even your competitors you get a clear picture of how well it performs compared to the competition and find a way to outperform them.
- Justifying investments: we all know stakeholders love numbers. Usability testing metrics provide tangible evidence of the problem existing, and help to demonstrate the value and potential return on their investment.
Overall, usability testing is a proven method of evaluating your product and uncovering hidden usability issues. It brings both qualitative and quantitative insights to the table, and by keeping track of some of its metrics you’re able to really make sense of these huge amounts of data and prioritize changes that matter.
By constantly measuring the usability of your product you’re committing to improving it and fine-tuning its design and functionality to suit users’ needs.
Don’t believe us? Check out these usability testing demos and their PDF reports and see how metrics can help you assess usability:

Types of usability testing metrics
There are 3 main types of usability testing metrics that you can track:
- Effectiveness: describes whether or not a user is able to complete certain tasks with your product and how effectively they manage to do it.
- Efficiency: efficiency metrics assess how quickly and with what amount of effort users are able to complete those tasks.
- Satisfaction: satisfaction metrics help to evaluate users’ overall satisfaction with the experience your product provides. They help assess user perceptions, preferences, and emotional responses.
As we can see, these are categorized based on the different types of information they help to obtain. This type of categorization can help you greatly with choosing the right metrics to track in your own usability study.
For example, you want to find out how easy it is for the user to complete a certain task with your product. Based on that goal you can choose the specific metrics that will help you find out and analyze those details. In this case, to measure efficiency, you’ll need to track “Time on task” and “Efficiency” metrics.
But that’s just an example, let’s take a look at why these metrics and not the others and learn more about each of them.
Usability testing metrics for measuring effectiveness
Success Rate
The success rate is one of the most essential and basic metrics in a task-based usability test. It shows the percentage of the participants who successfully completed the task vs. the ones who did not.
The formula for calculating the success rate manually is: the total number of successful tasks of all respondents divided by the total number of tasks performed by all respondents.
A study by Jeff Sauro from 2011 found that 78% is an average success rate, so if you’re anything over that on your test – that’s a great score. However, a lower result signifies that there’s still room for improvement and a lot to work on.
Users being able to complete the task should be your number one priority. If half of your testers are not able to successfully perform a certain action with your product this is most likely a sign of major usability issues.
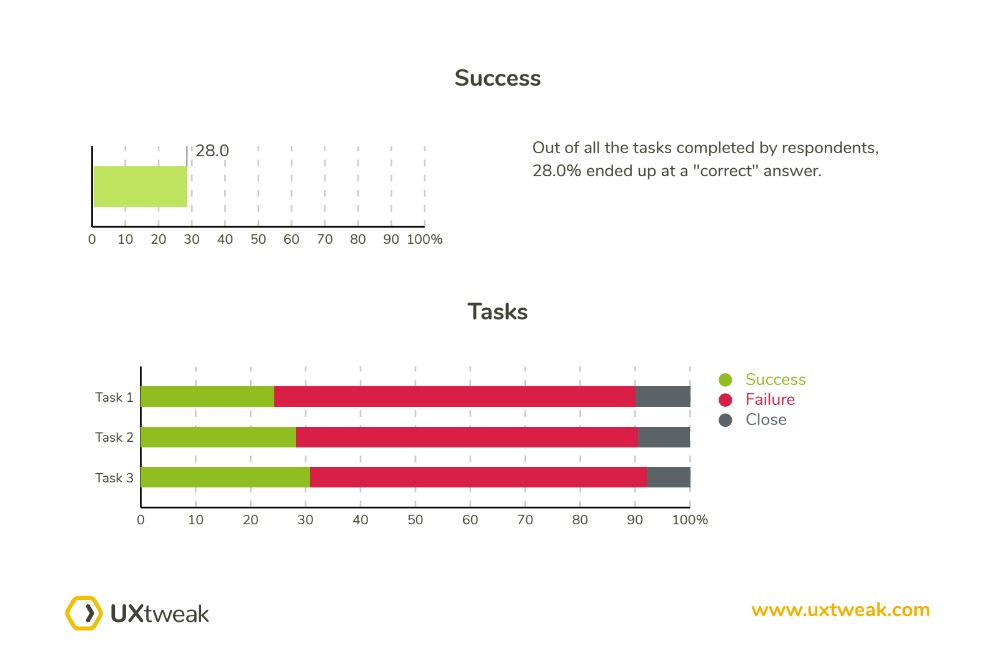
With UXtweak’s Usability testing tool you can generate the success rate for the whole study and each task individually. This allows for a better understanding of where the problems lie and at what stage of the journey users encounter them.
Here’s an example of the success rate chart from the UXtweak app:
Number of errors
A number of errors, also known as error rate, measures the number of errors made by users when completing your usability test and interacting with the product. It’s basically the opposite of the success rate.
In task-based usability tests, you always define an ideal path a user should take to complete the task, where they should start and finish. The error rate shows how many times users move away from this path, click the wrong button, open the wrong page, etc. The higher your product’s error rate is, the more usability problems there are.
To count the error rate, divide the total number of errors by the number of attempts. This is the calculation for tracking multiple errors across your study.
However, there’s another formula for calculating the error rate for a specific task. For it, you need to divide the number of times an error occurred by the total number of opportunities for that error.
To give you an example, if the task has 3 error opportunities (specific elements or places in your UI where testers can make a mistake) and 10 users try to complete it, the number of opportunities would be 30. Imagine you then found 4 errors after the test.
Here’s how you’d calculate the error rate for that task: 4/30=13,3%
To save time on these calculations, consider conducting your usability test using one of the online usability testing tools. They count all the errors automatically and just present you with the results.
Usability testing metrics for measuring efficiency
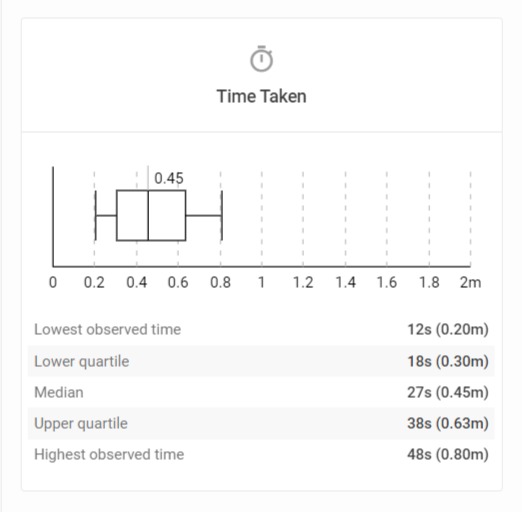
Time on task
Time on task is the simplest metric ever to track how fast and efficient users perform specific tasks with your product.
Ideally, you want them to do it as quickly and simply as possible. Therefore, when you see that a certain task takes users longer to complete, this might be a sign of them experiencing confusion, probably due to the usability issues.
There’s no perfect time for that metric, as it always depends on the task and its complexity. However, you can always tell when the task takes longer to complete than it should’ve.
For example, you’re asking the user of your eshop to add an item to the cart. This process should only take a couple of seconds, until they find the right icon. If you see that the user hesitates or it takes them a couple of minutes to complete this task, you probably need to look into it and see what confused them.
There could be a number of reasons, such as an unfamiliar icon, a bug on the product page, an inactive button etc. Watch the recordings of your test and find out what went wrong.
Here’s how this metric looks inside the UXtweak app:
Efficiency
The efficiency is a lot more complicated metric to track, due to its formula. It is measured with the help of other metrics, specifically the “Success rate” and the “Time per task”.

Where:
N = The total number of tasks
R = The total number of users
nij = The results of task ‘i’ by user ‘j‘. If the user has completed the task, then Nij = 1, if not, then Nij = 0
tij = The time spent by user ‘j’ to complete task ‘i’. If the task is not completed, time is measured until the user quits the task.
This metric helps to measure time-based efficiency, meaning, how quickly and easily users can complete tasks with your product.
Usability testing metrics for measuring satisfaction
System Usability Scale (SUS)
The System Usability Scale is a questionnaire that is sent out to the participants after the test and helps to assess the perceived usability of the product.
It always consists of the same 10 Likert-scale questions and has been used to measure usability for decades. The answers to those questions range from 1 = strongly disagree, to 5 = strongly agree.
Here just a couple examples of the questions in SUS:
- I think that I would like to use this system frequently
- I found the system unnecessarily complex
- I needed to learn a lot of things before I could get going with this system.
The average SUS score is 68. The higher it is, the better is your product’s usability.
Overall SUS is a proven metric to assess how easy to use your product is for the target audience.
💡 Do you already have the results from the SUS questionnaire? Check out our SUS score interpretation.
Single Ease Question (SEQ)
The Single Ease Question metric helps to assess how easy each task was for the user to complete. It is administered immediately after the task completion and consists of just one question and a 7-point rating scale:
Overall, how difficult or easy was the task to complete? (1 = very difficult, 7 = very easy)
This metric helps to evaluate how easy or difficult it is for users to perform a certain action with your product. Studies show that the average SEQ score is around 5.5.
If most of the participants vote for the task to be difficult and hard to complete, this may be a sign that you need to simplify the user flow and make the design more intuitive. It may also signify that there’s a major usability issue that keeps users from completing the task with ease.
In online usability testing tools like UXtweak you can set this question to automatically appear after each task and quickly gather feedback on it.
Subjective Mental Effort Questionnaire
SMEQ helps to measure the subjective mental effort of each respondent after completing the task.
It consists of one question and is especially helpful for measuring the cognitive load required from the participant to complete the task. Its scale has nine labels from “Not at all hard to do” to “Tremendously hard to do”, which are shown as millimeters above a baseline from 0-150.
How to compare two designs using usability testing metrics
Usability testing metrics offer a great opportunity to quantify your usability and use those numbers to compare two different designs to each other.
This, for example, can be useful when you’re making a redesign of your product or trying to compare your design to one of your competitor’s.
Case #1: Redesign
The process here is to start by running a usability test on the old version of your product, analyze the results and calculate the usability metrics that you want to compare later.
After the redesign, conduct a usability test on the prototype of the updated product. We recommend testing prototypes specifically and not the already developed version for a reason. This will leave you the opportunity to spot usability issues and eliminate them before the development.
You can easily conduct a prototype test with UXtweak Prototype Testing Tool! It will allow you to quickly set up the study, administer it to the respondents and generate all the necessary metrics for you!
After you have the usability testing metrics for both designs, you can compare them and evaluate the effectiveness and success of your redesign. By doing this you can still spot areas for improvement. This comparison also gives you precious data to present to stakeholders and explain how your solutions made the product better.
Case #2: Competitive Usability Testing
Alternatively, you can use usability testing metrics to compare your product to one of your competitor’s. This can be done by conducting Competitive Usability Testing on your competitor’s website, for example.
With the help of UXtweak Chrome extension you’re able to perform just the same usability test with your competitor’s product as you would with your own! Don’t believe us?
Conduct two usability tests using the same tasks, one on yours and one on your competitor’s product. This will get you specific usability testing metrics that you can then compare and analyze where they are doing better. This is a perfect opportunity to optimize the UX of your product by replicating some of the best practices used by your competitors!
After the comparison you’ll probably get a similar table for each of the metrics*:
Your website | Competitor's website | |
Task 1 | 20s | 17s |
Task 2 | 47s | 49s |
Task 3 | 60s | 27s |
Success Rate | 85.5% | 80% |
*the table represents the comparison of the success rate and time taken for each of the tasks.
Most of the time, you can’t really make any serious product decisions only based on the comparison of usability testing metrics. This would require a more detailed analysis of usability testing results to find out how users actually interact with the product and where they get confused. However, such a table will allow you to pinpoint where your product is lacking and then conduct further analysis in that area.
Wrapping up
Measuring usability is essential to keep track of your product’s performance and spot issues early on. As we can see there are a lot of different metrics one can use to evaluate the usability of their product. Choose your metrics wisely and never base the analysis on a single one.
Create an account at UXtweak and use our usability testing tools to evaluate your product!
With UXtweak you can save time on the analysis and calculations! We help you with that, analyze the results for you and automatically calculate all the usability testing metrics. We offer robust PDF report features to help you generate amazing customized reports for presenting your insights to stakeholders and team members!